This page is a draft at this point. Its goal is to hold all info about diagramming, that we think is valuable for our customers. Subscribe to the page if you want to stay in the loop.
This research page may contain unfinished or unconfirmed info!
This is a research page. Seibert Media uses research pages to prepare relevant topics and gather information about stories we want to run. Such research pages often evolve over a long period of time without quality assurance and cross-checking from our business experts. While all web content should be consumed cautiously, this page may still contain unconfirmed or unfinished information. Please use the live chat or a contact form on this page to help us improve it. Please ask us if you're unsure. We're happy to help if we can. Your interaction also helps us gauge interest in this research page, so don't hesitate to contact us.
Keywords: Diagramming, Diagrams in UML, Information visualization
UML Diagrams
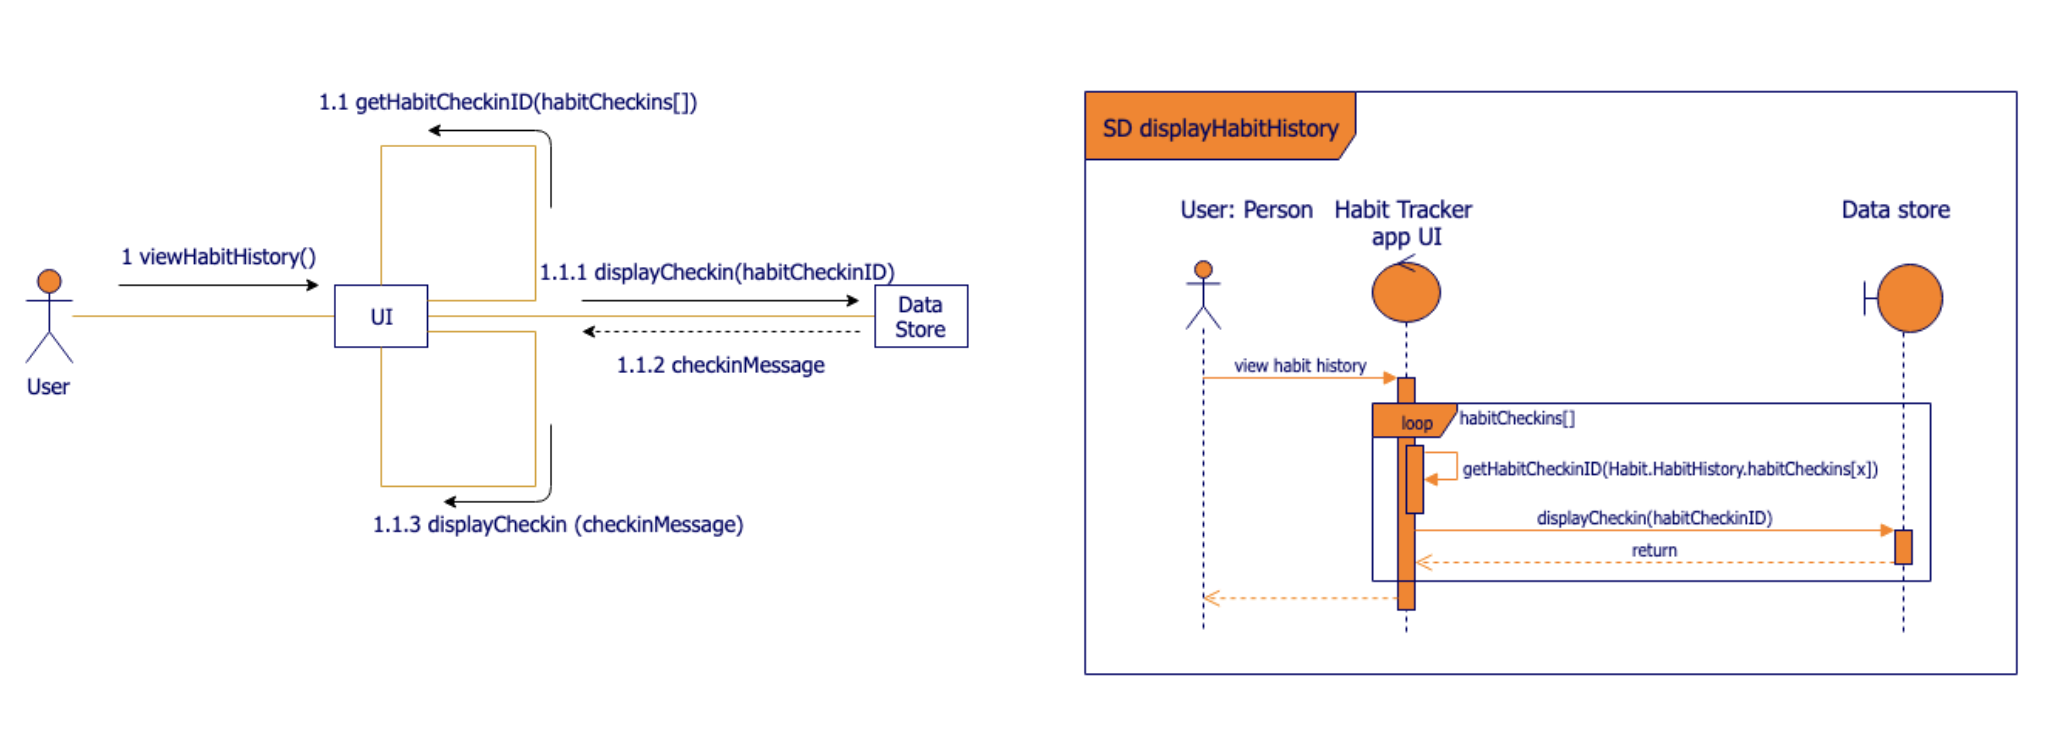
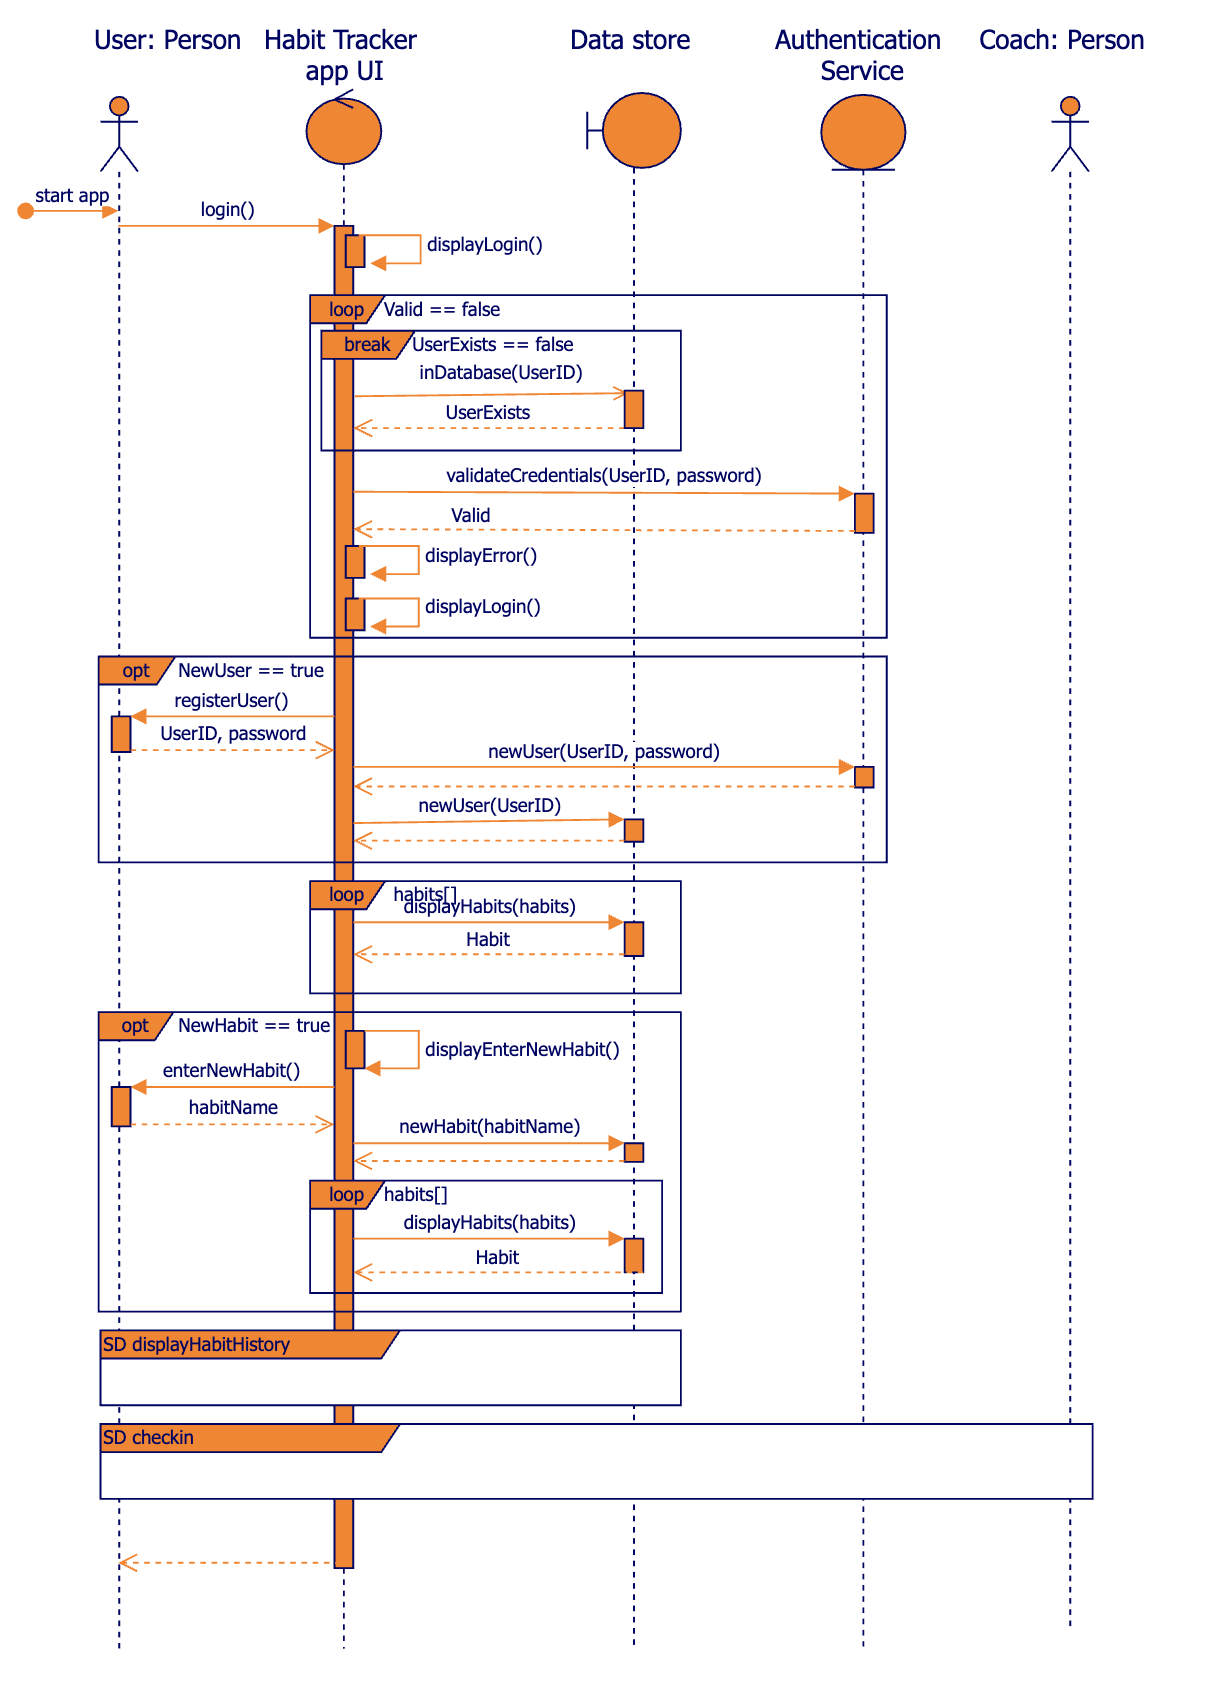
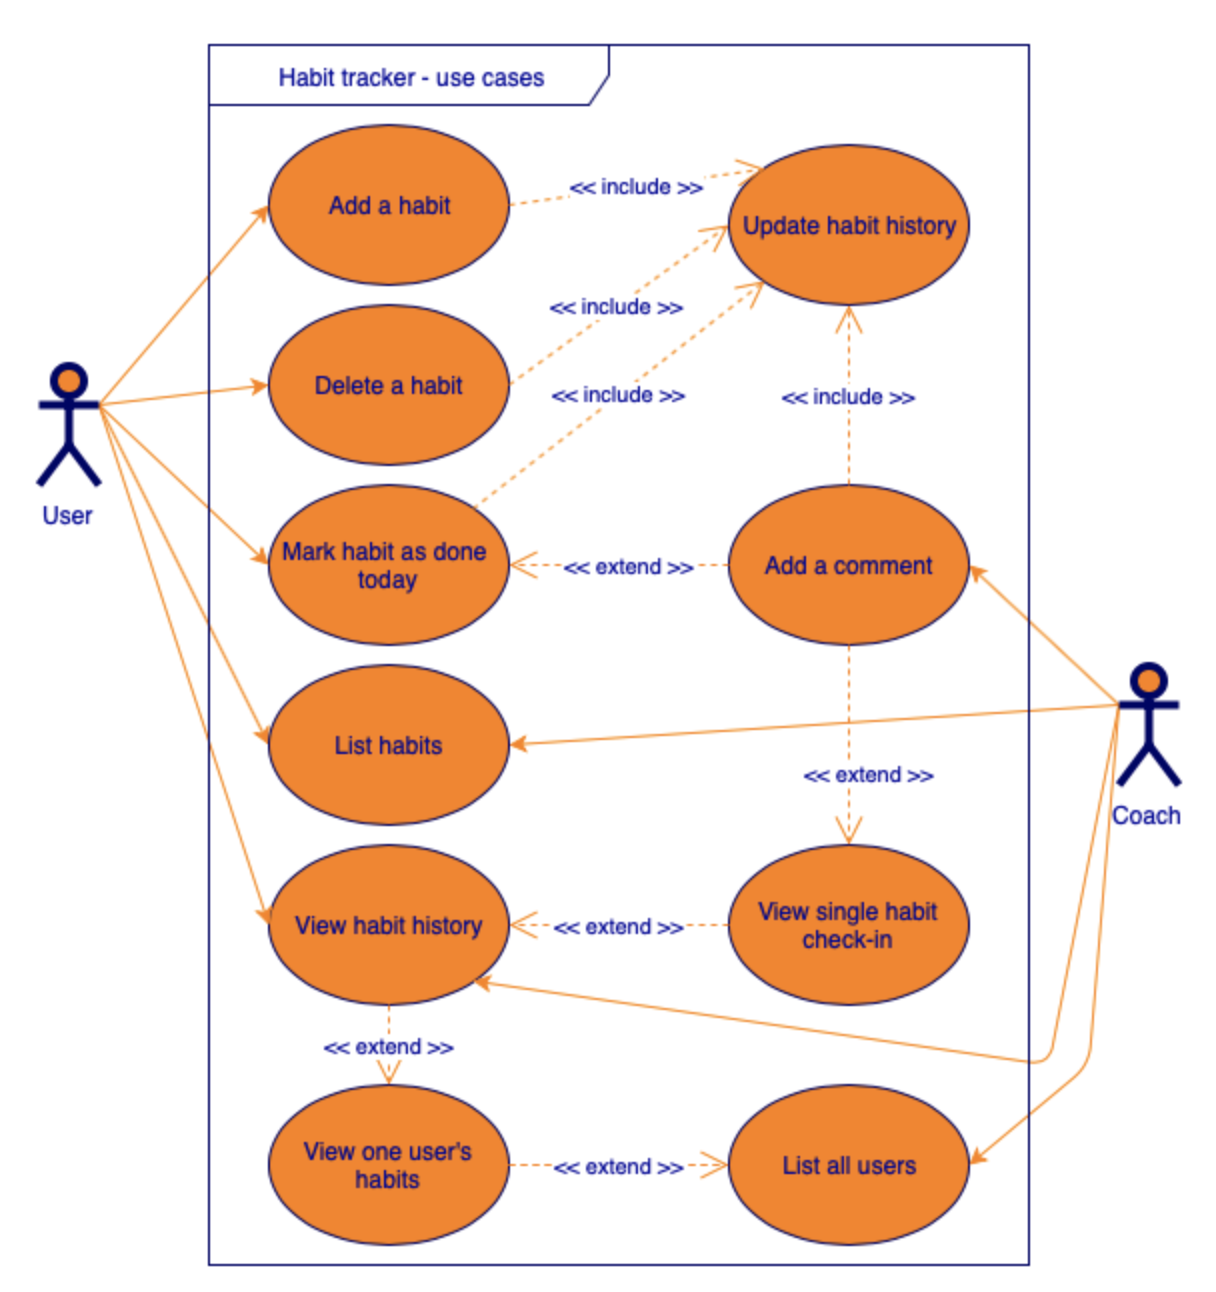
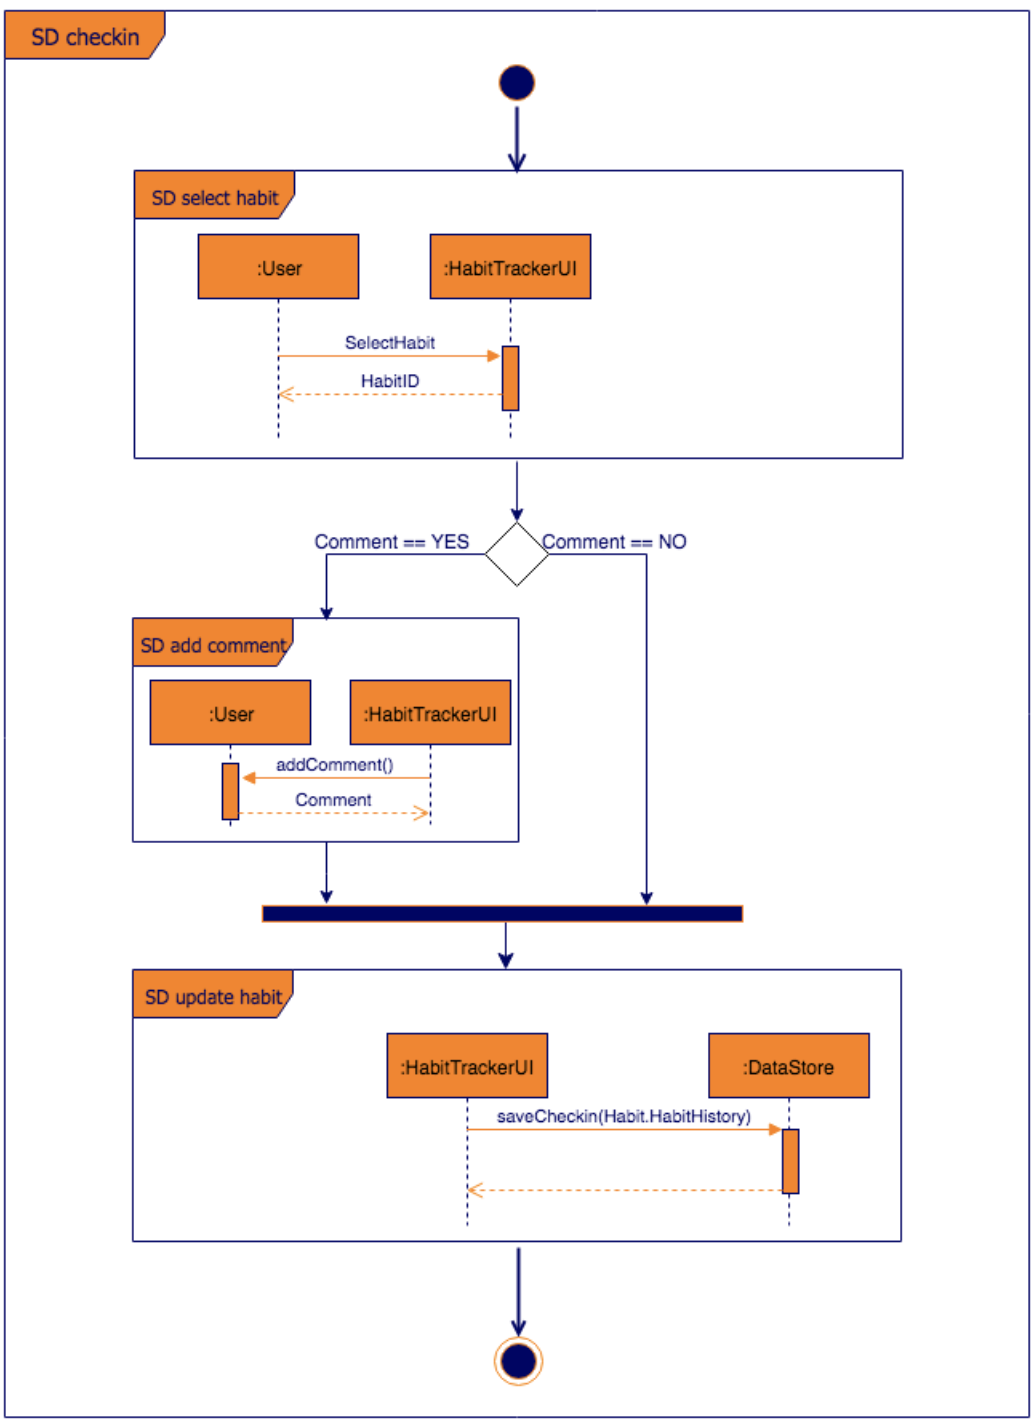
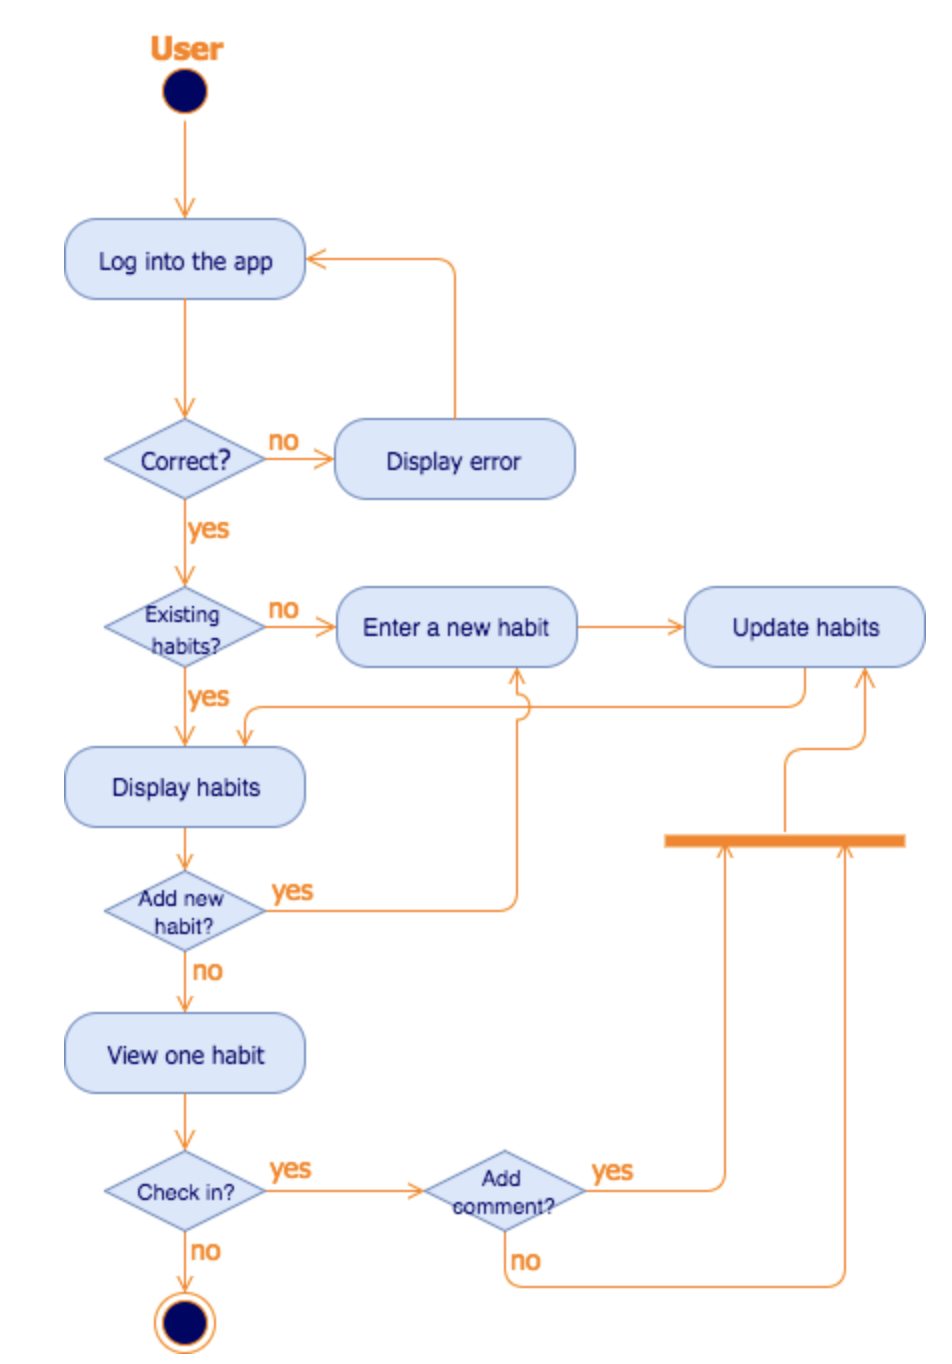
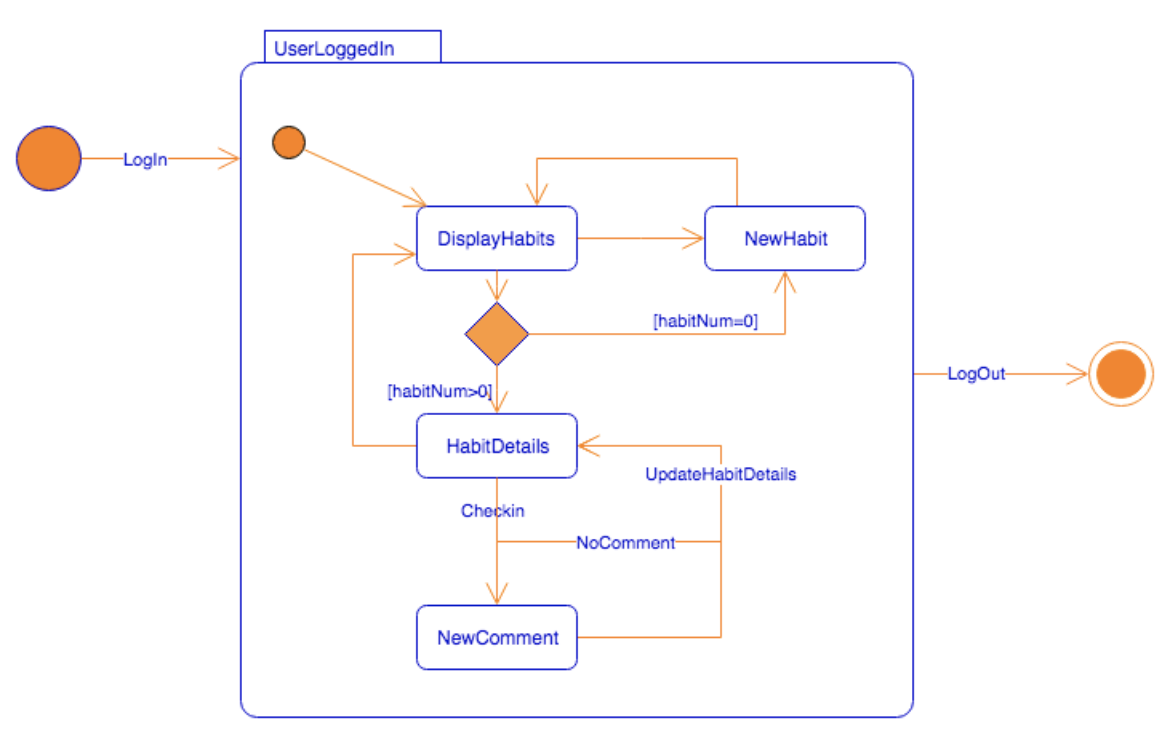
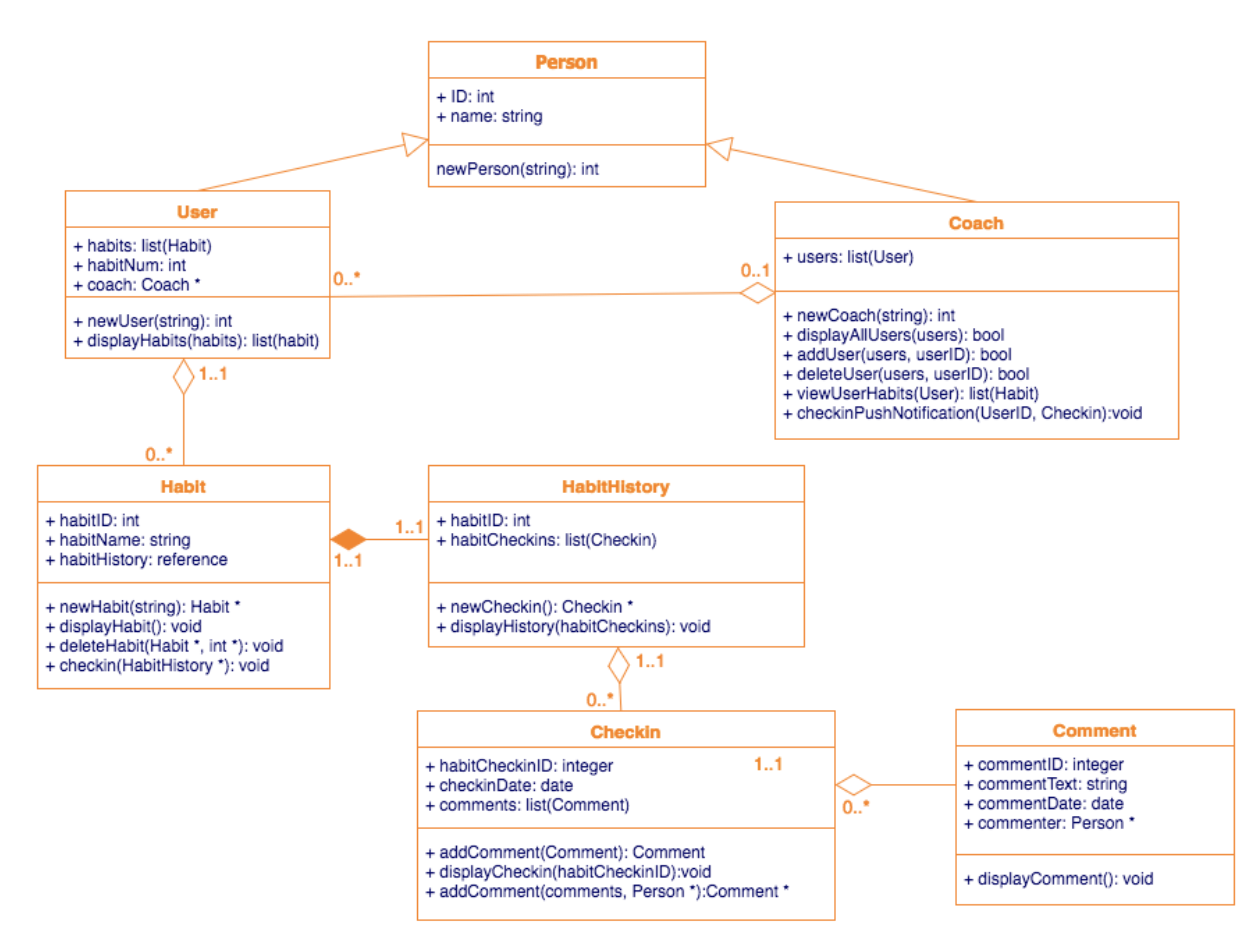
UML Diagrams (Unified Modeling Language) is a way to visually represent the architecture, design, and implementation of complex software systems. The complexity of writing codes and keeping track of relationships and hierarchies within a software system is difficult. UML diagrams divide the software systems into components and subcomponents making it easier to organize and showcase engineering requirements. There are 14 types of UML diagrams, which are divided into two groups.
Types of UML Diagrams
Source: view diagram in draw.io