
This page is a draft at this point. Its goal is to hold all info about the Customer Journey diagram, that we think is valuable for our customers. Subscribe to the page if you want to stay in the loop.
This research page may contain unfinished or unconfirmed info!
This is a research page. Seibert Media uses research pages to prepare relevant topics and gather information about stories we want to run. Such research pages often evolve over a long period of time without quality assurance and cross-checking from our business experts. While all web content should be consumed cautiously, this page may still contain unconfirmed or unfinished information. Please use the live chat or a contact form on this page to help us improve it. Please ask us if you're unsure. We're happy to help if we can. Your interaction also helps us gauge interest in this research page, so don't hesitate to contact us.
Keywords: Diagramming, Business Diagram, Business analysis, Customer Journey, User Journey
Customer Journey Map
The Customer Journey map (also known as User Journey or Buyer Journey) is a visual representation of a customer's path or complete sum of experiences, via touchpoints, a customer goes through when interacting with a company and its brand. The model assumes that the customer rarely makes decisions spontaneously, but rather gets in touch with a brand, a product, or service at different points in the journey. This also provides the opportunities to analyze user behavior and gain insight into potential pains and gains that the common customer may experience, which in turn allows businesses to optimize the customer experience and direct them towards a purchase decision. Organizations across the world know that delivering a good customer experience leads to competitive advantage, lower costs, and higher profits. The customer journey is divided into five phases, which is refered to the AIDA model.
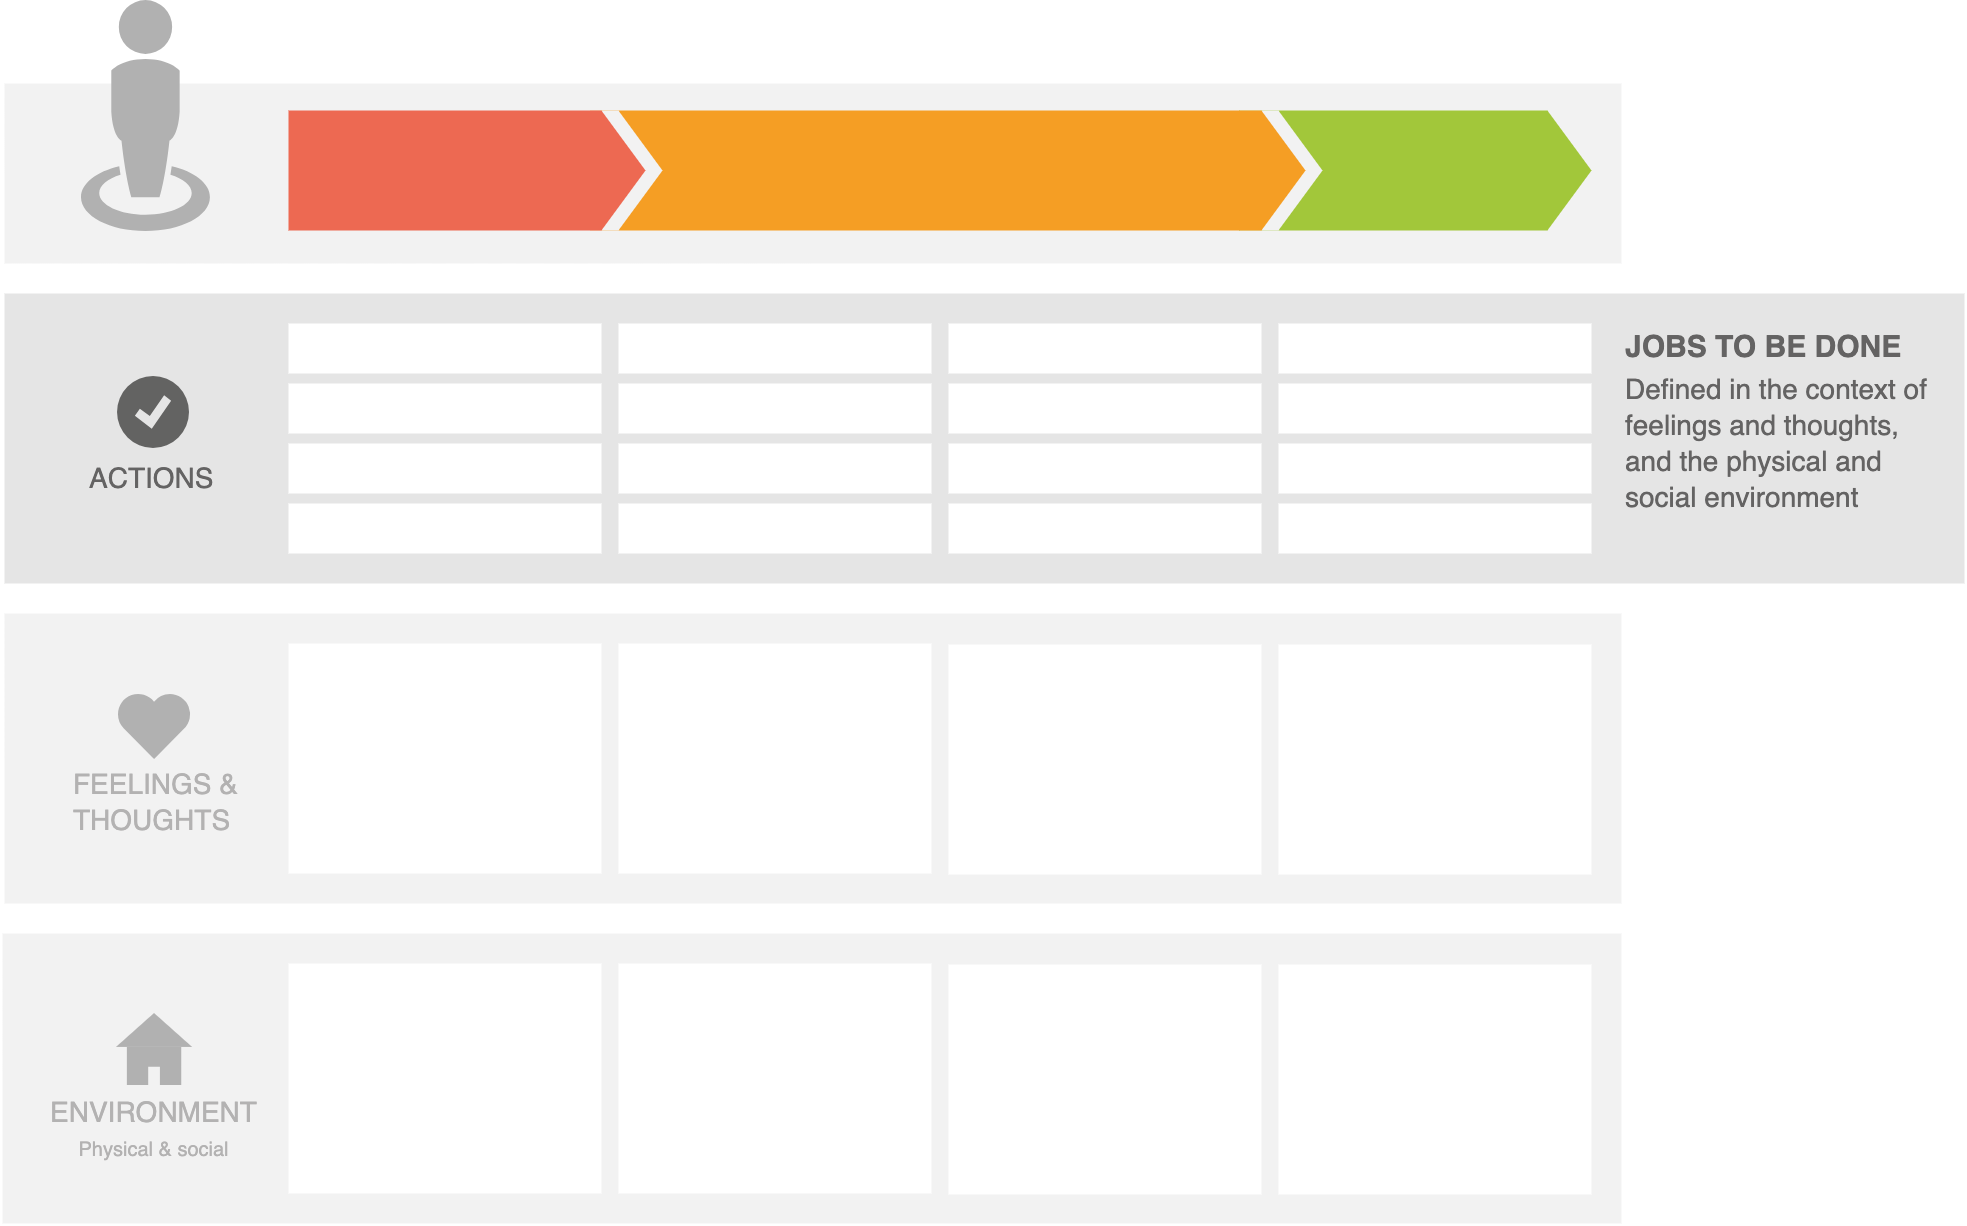
Generic sample of a Customer Journey map source: Draw.io for Confluence
