
Monitoring concept
Continuous monitoring of critical components for highly available systems
Our central monitoring concept ensures that your systems are securely set-up. We are monitoring critical components and important metrics around the clock. Depending on your selected SLA, our system administrators are informed about essential incidents immediately, within the service period, and independently begin to remedy them. Our monitoring concept allows you to counteract business-critical downtimes and increase the availability and performance of your systems.
Capturing system metrics through monitoring
In addition to our monitoring, we have long-term time series of many of the operational metrics in high time resolution. This allows us to analyse past problems or read general trends. In the case of performance-relevant issues, considerably more information for analysis can be obtained.

The following components, among others, are monitored by our monitoring system:
Application
 Accessibility of the login page of the application
Simultaneous connections to the application
Accessibility of LDAP server for authentication (optional)
Number of open files and processes (threads)
Various trends that indicate the application's utilization
Application memory utilization (JVM heap)
Application-specific checks: for example, insecure access permissions
SSL Certificate Expiration Date
Reverse Proxy Functionality
Database, Storage, Backup
The functionality of the database
The capacity of hard disk storage
Hourly snapshots of the file system (ZFS)
Daily backup of data to an external backup server
System
Utilization of the CPU and the main memory
Consistency between application URL and DNS records
Internet access
Correct synchronization of time services
The functionality of the mail dispatch
Installing operating system security updates
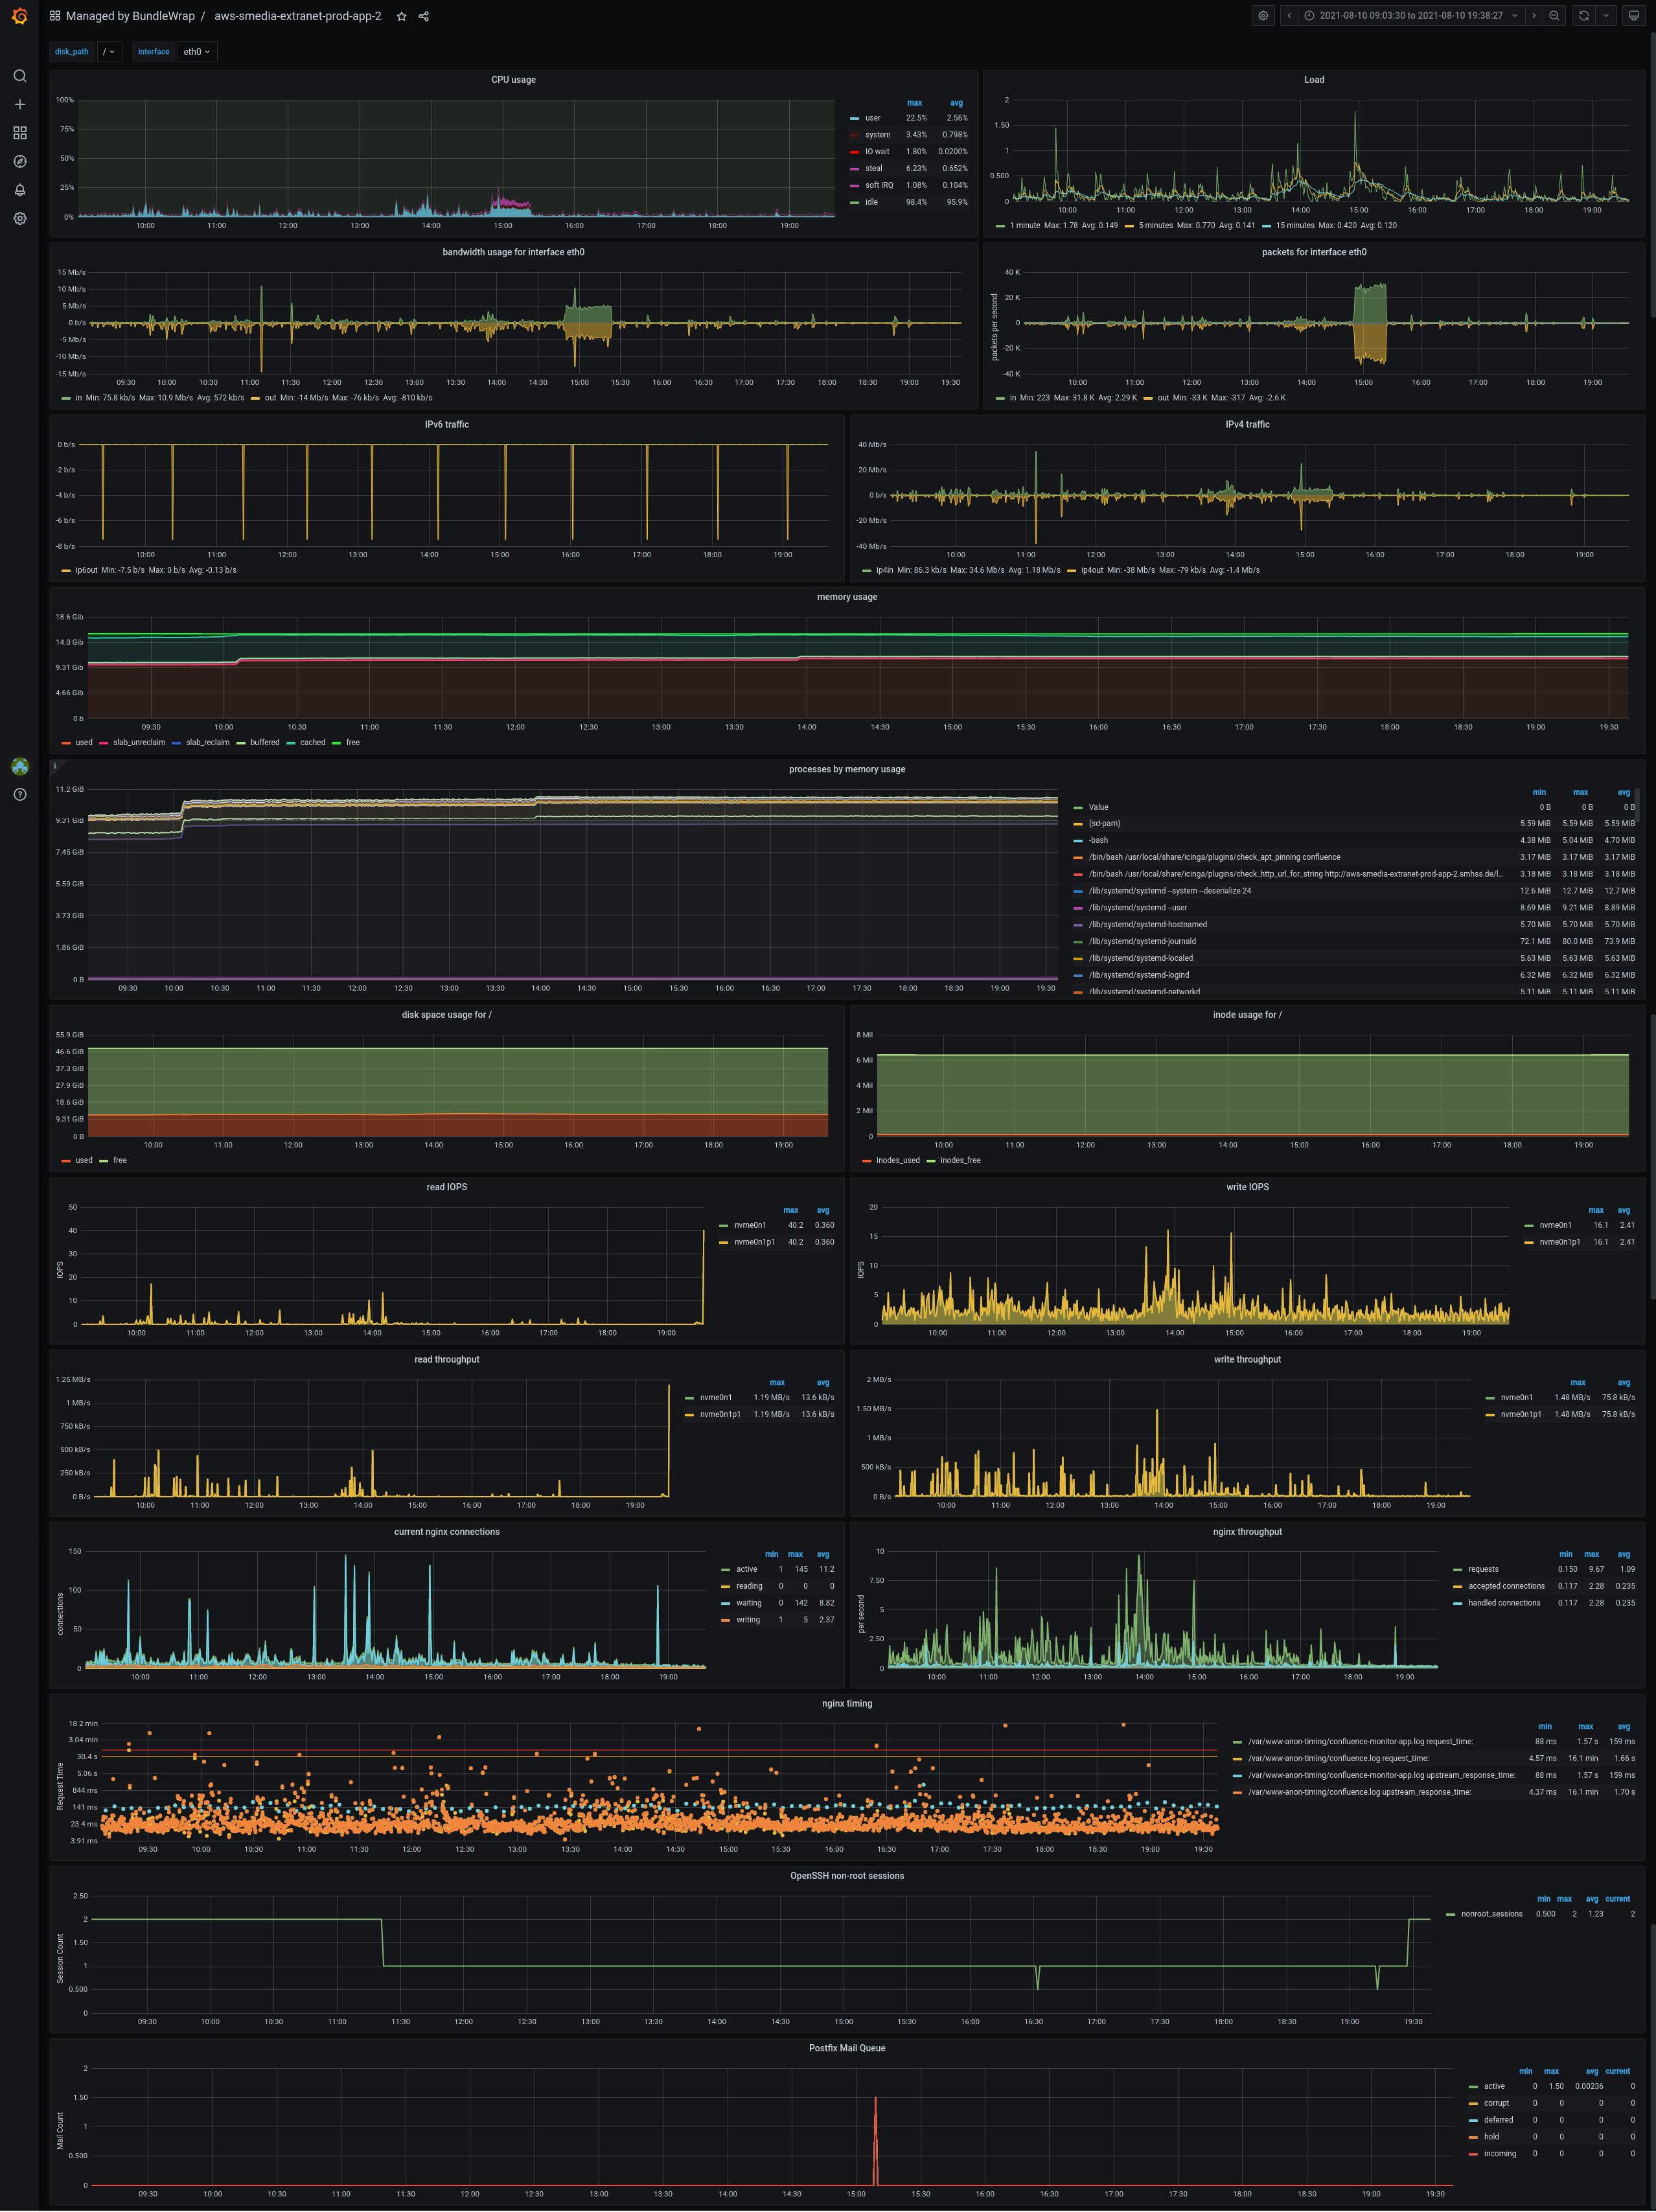
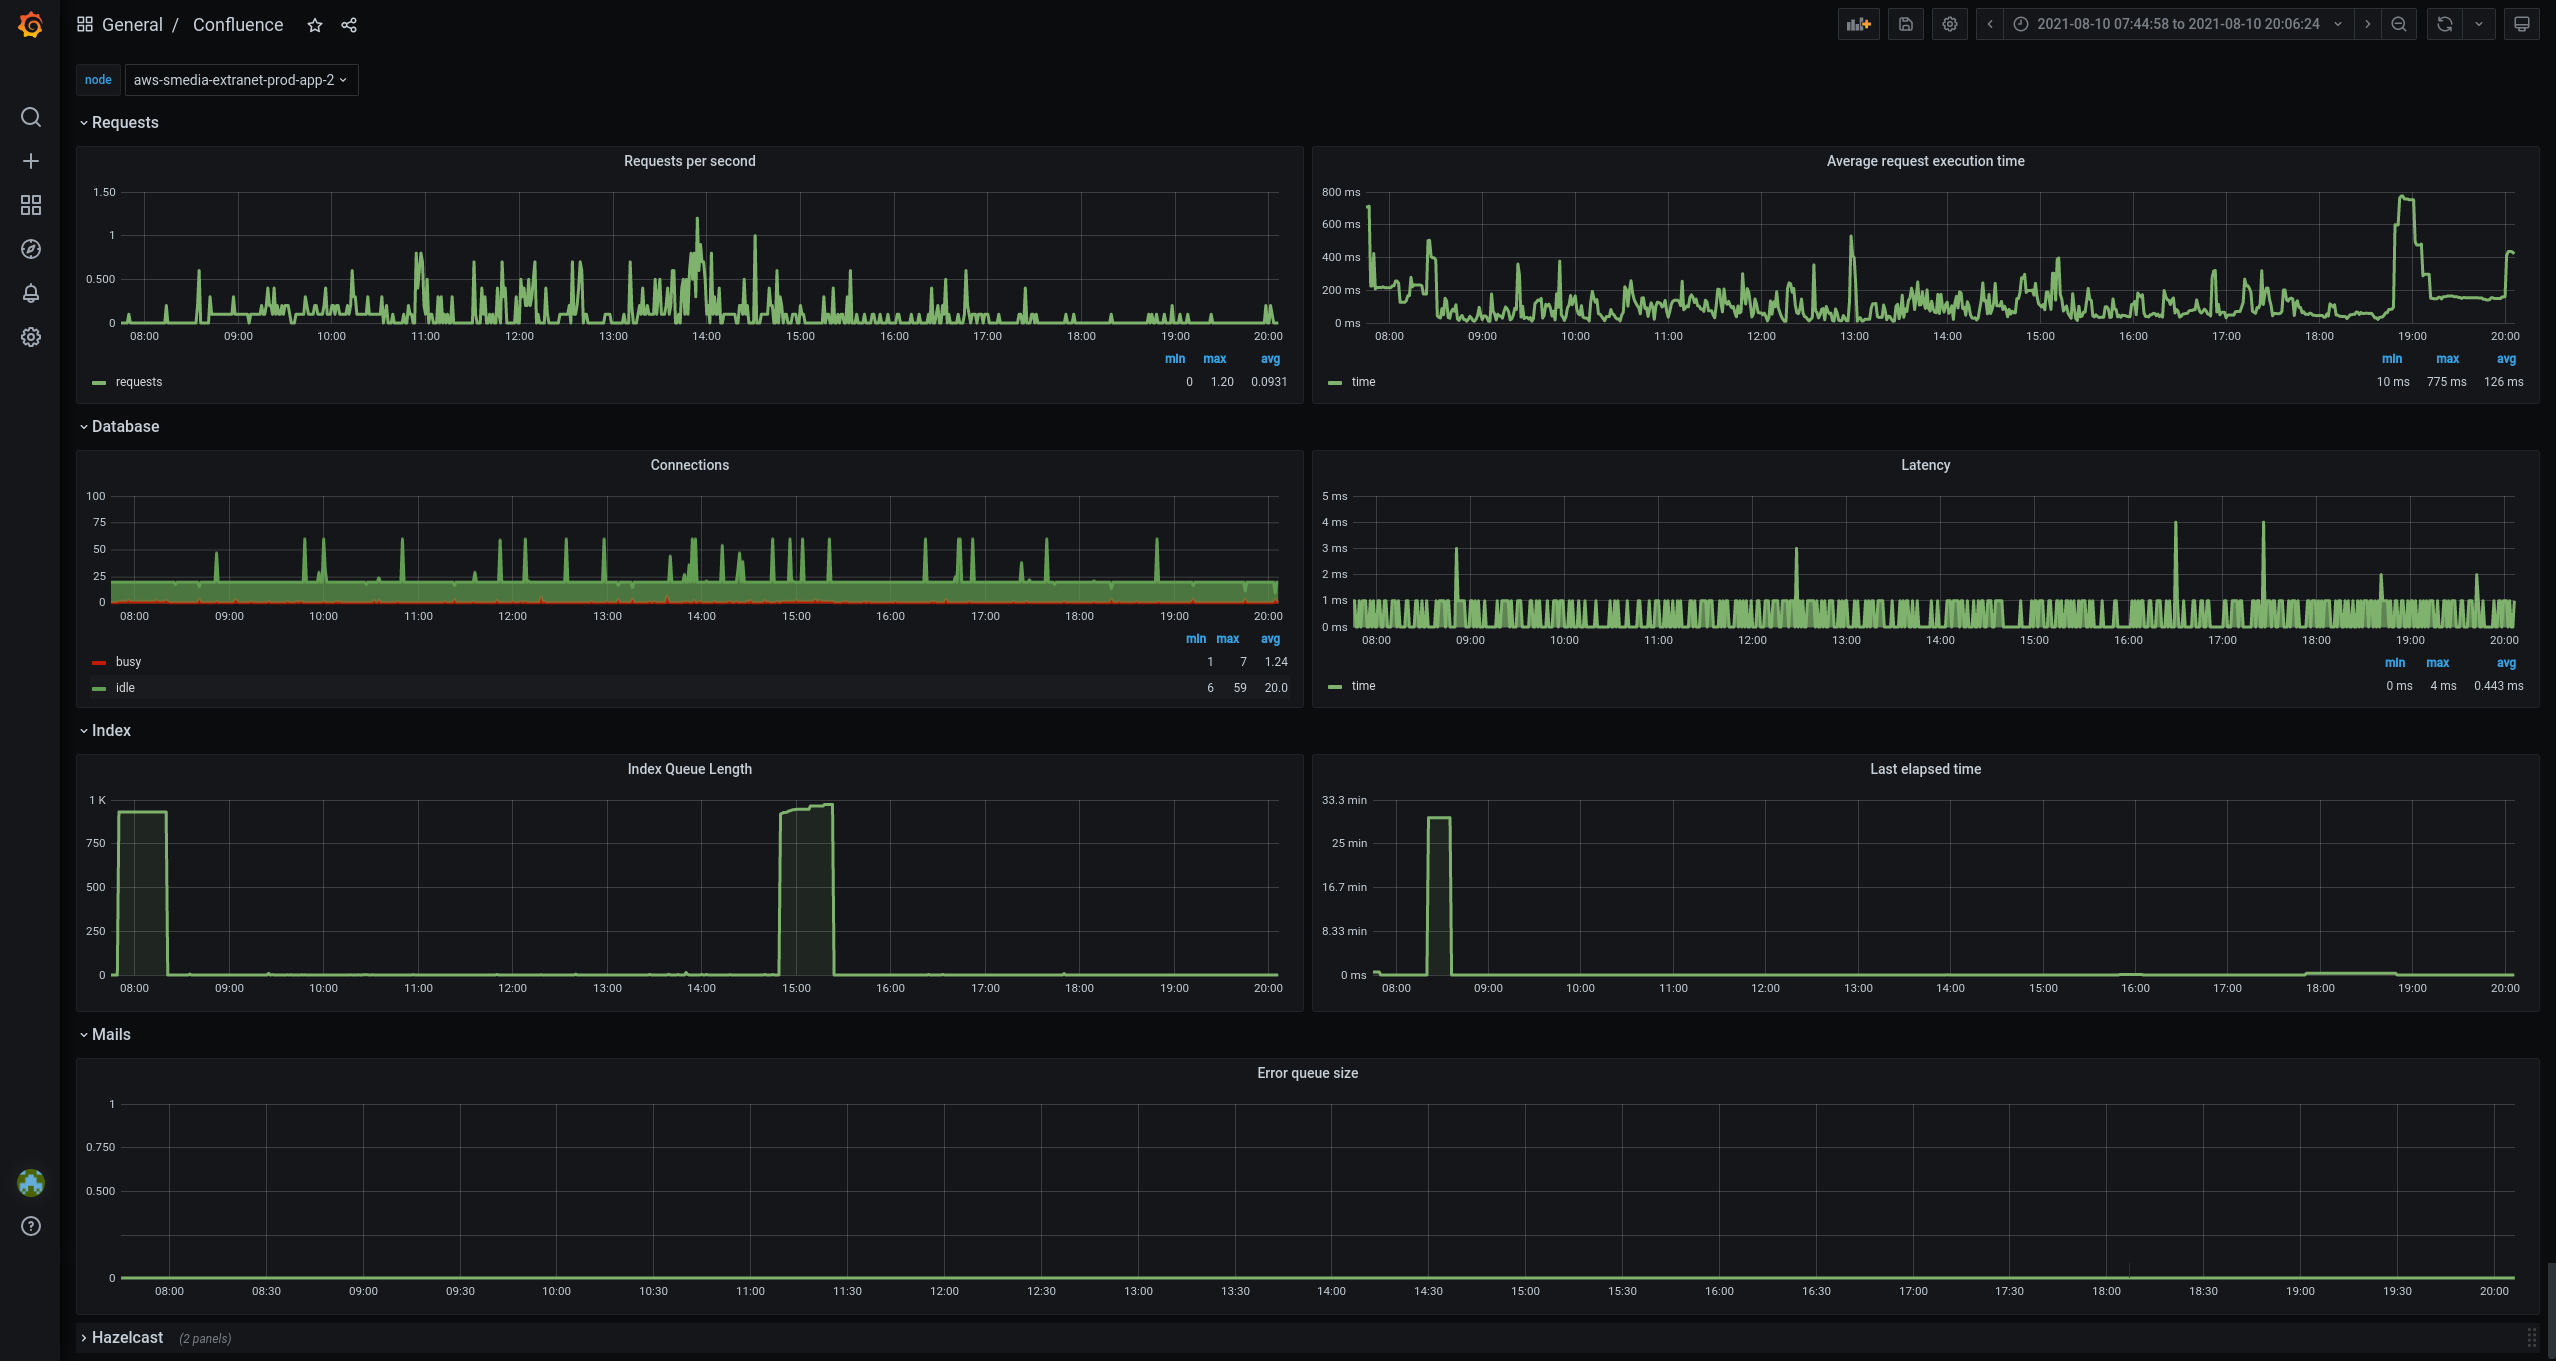
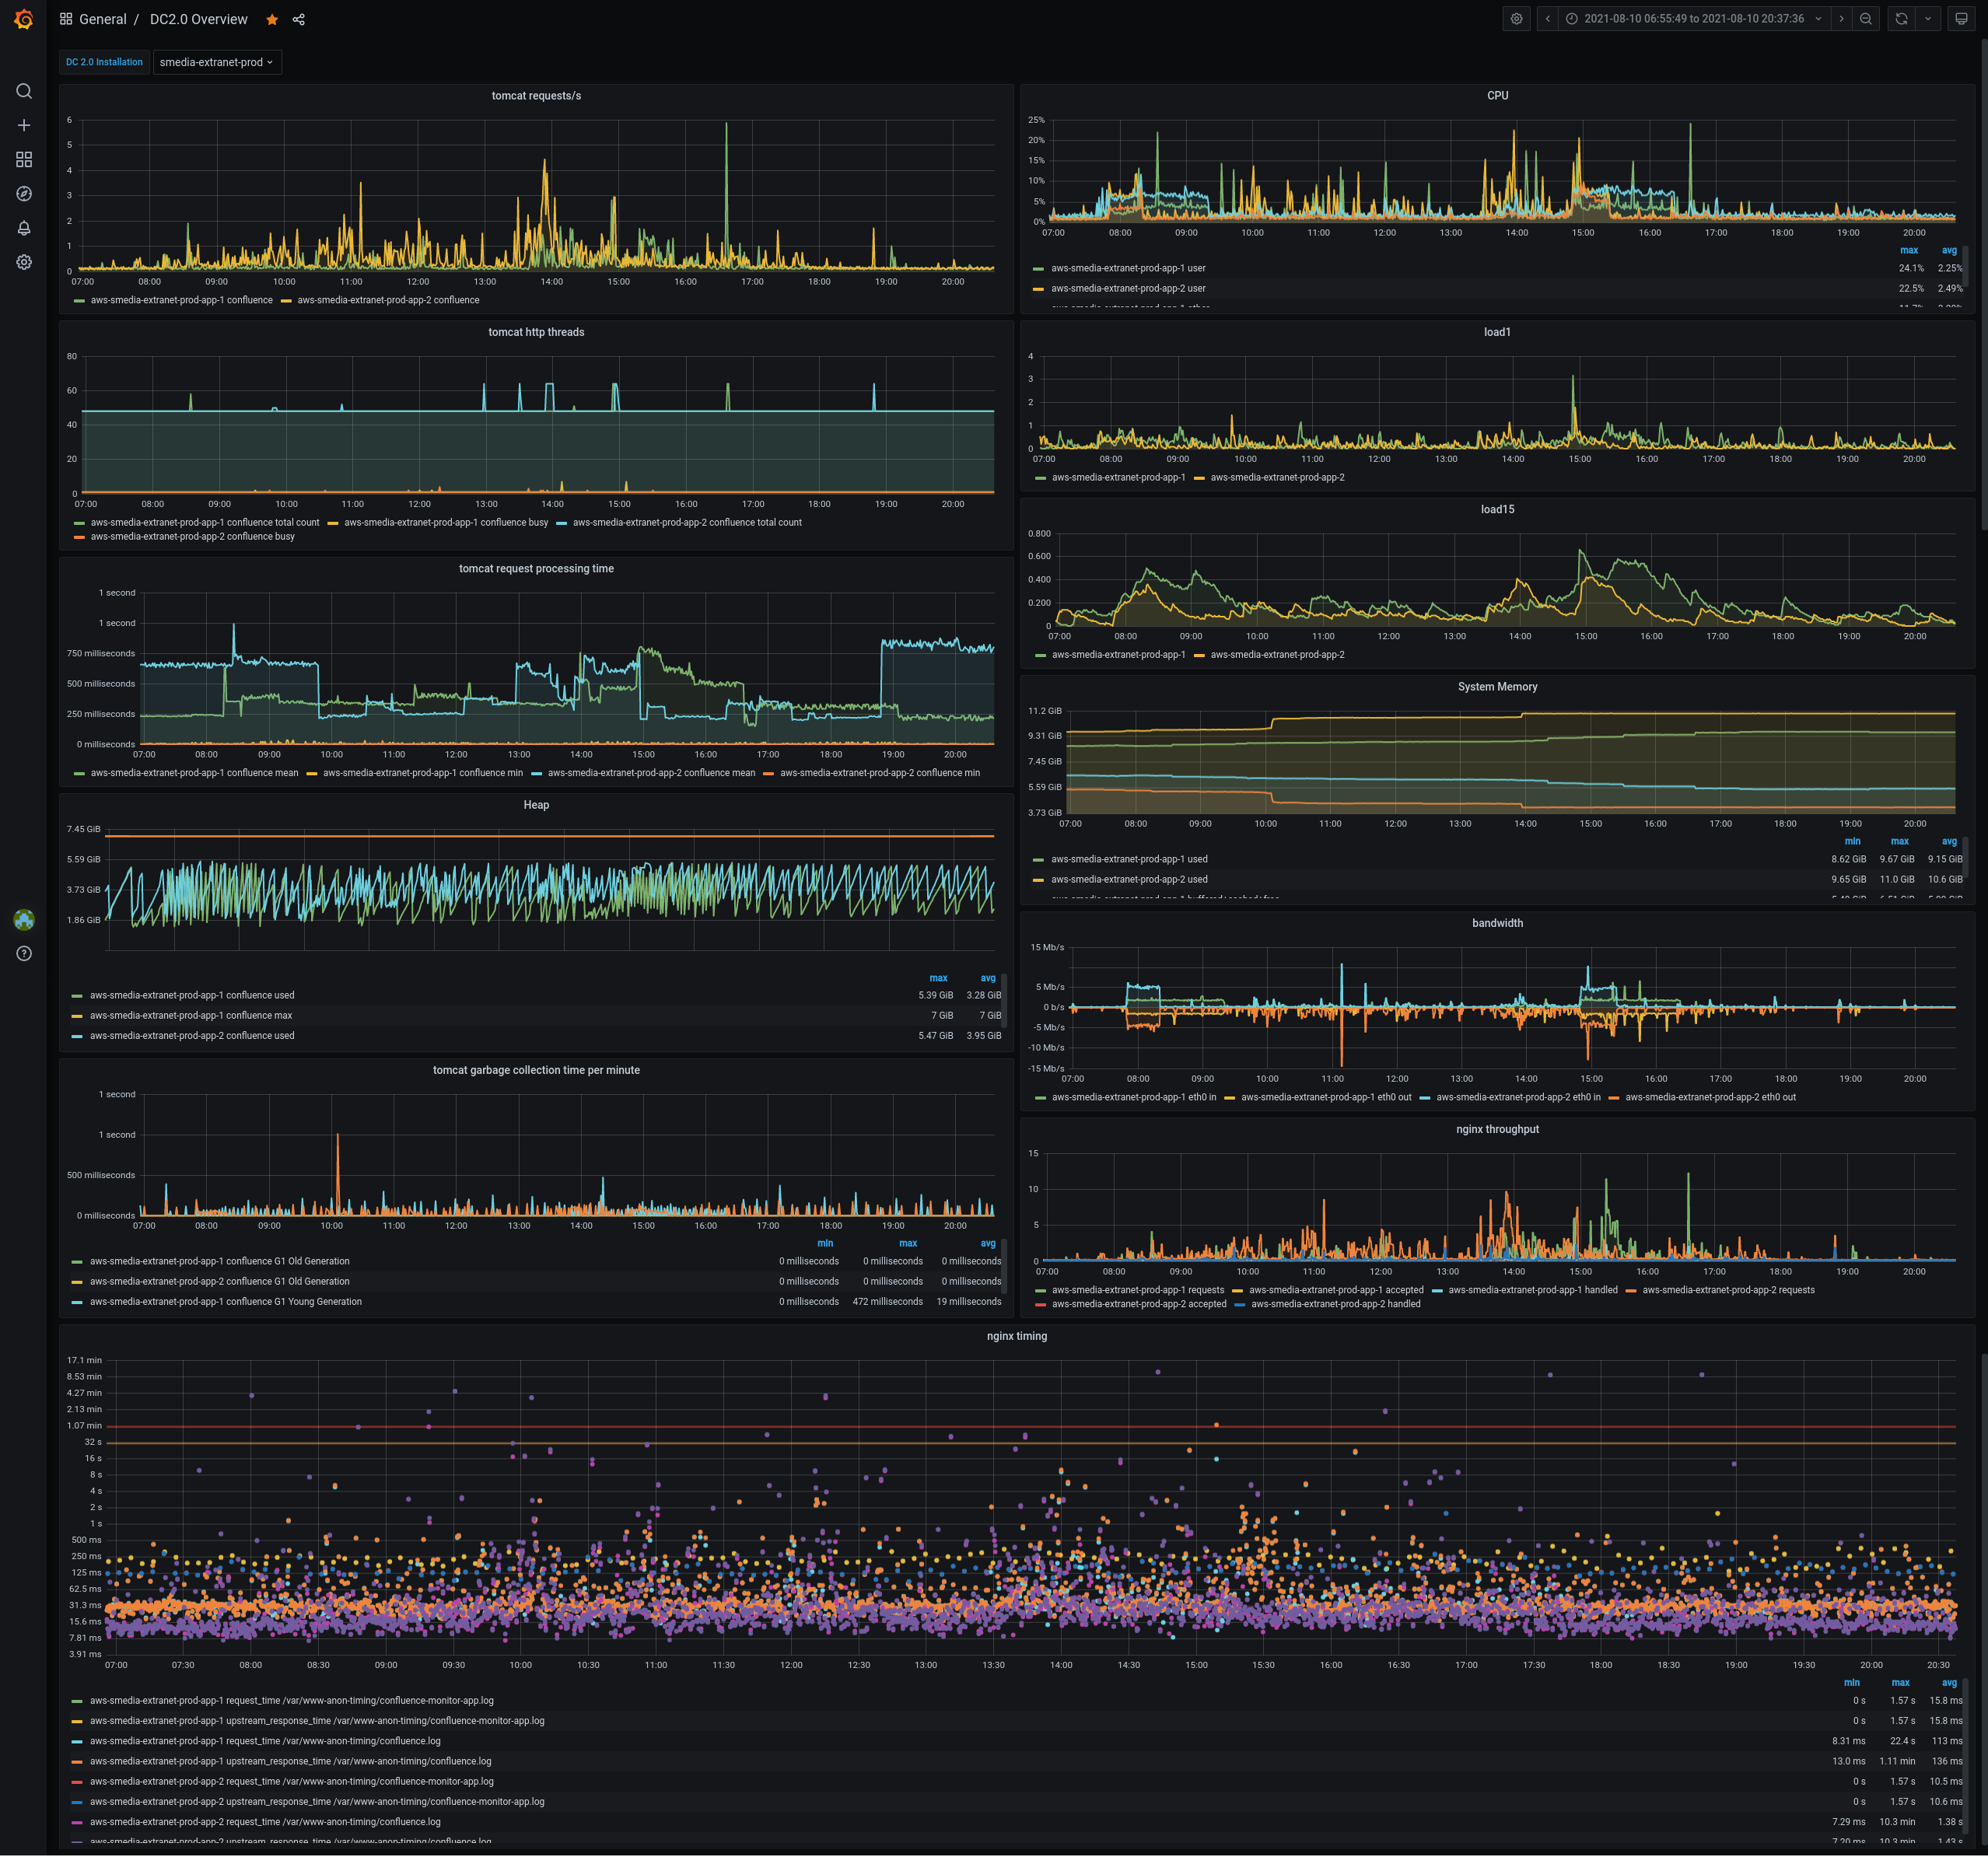
Timelines for the following metrics are recorded by our monitoring solution (extract):
CPU load + Load
Disk occupancy
Network utilisation
Memory usage (system + application)
Java threads (http + non http)
Number of accesses
Application response times
Memory consumption per process
Application memory utilisation (JVM heap)
Garbage collection
Java code cache
Example of recorded metrics in our monitoring solution:
More about operation packages: